

 BCH/USD The bulls did not allow Bitcoin Cash (BCH) to plummet back below the $370 breakout level on Jan. 4 and 5. This shows accumulation by traders at lower levels. The bulls are currently attempting to resume the uptrend 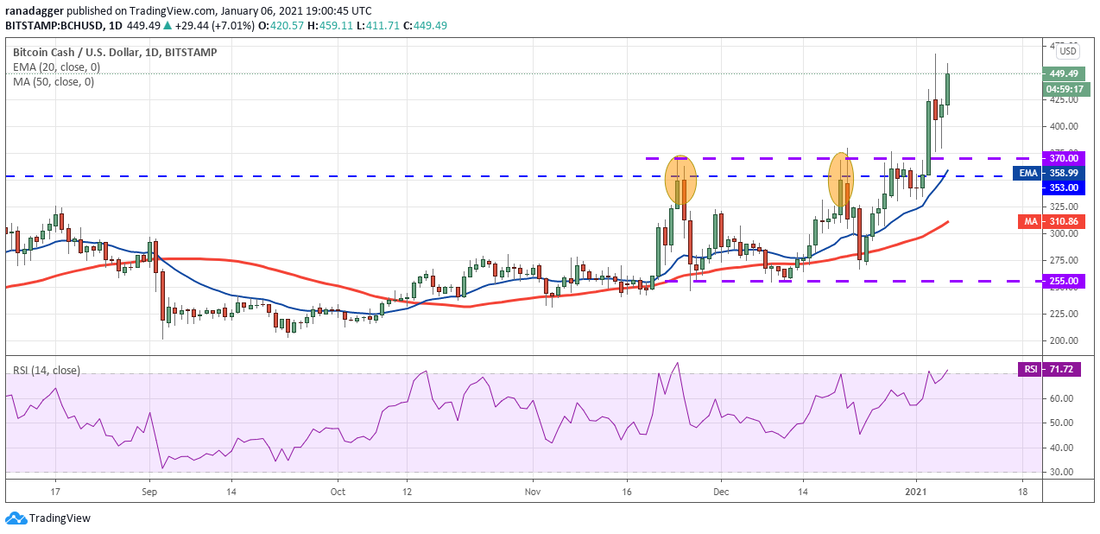 If the bulls can push the price above $467.67, the BCH/USD pair may rally to the stiff overhead resistance at $515.35. The previous two rallies had reversed direction from the $497 to $515.35 resistance zone. Thus this zone is likely to attract aggressive selling by the bears. However, if the bulls can absorb the selling and drive the price above $515.35, it may signal the start of a new bull run. On the contrary, if the price turns down from $467.67, the pair may consolidate between $370 and $467.67 for a few days. XLM/USD Stellar Lumens (XLM) has picked up momentum in the past three days. The altcoin broke above the descending channel on Jan. 05 and soared today, pushing the price above the $0.35 overhead resistance. 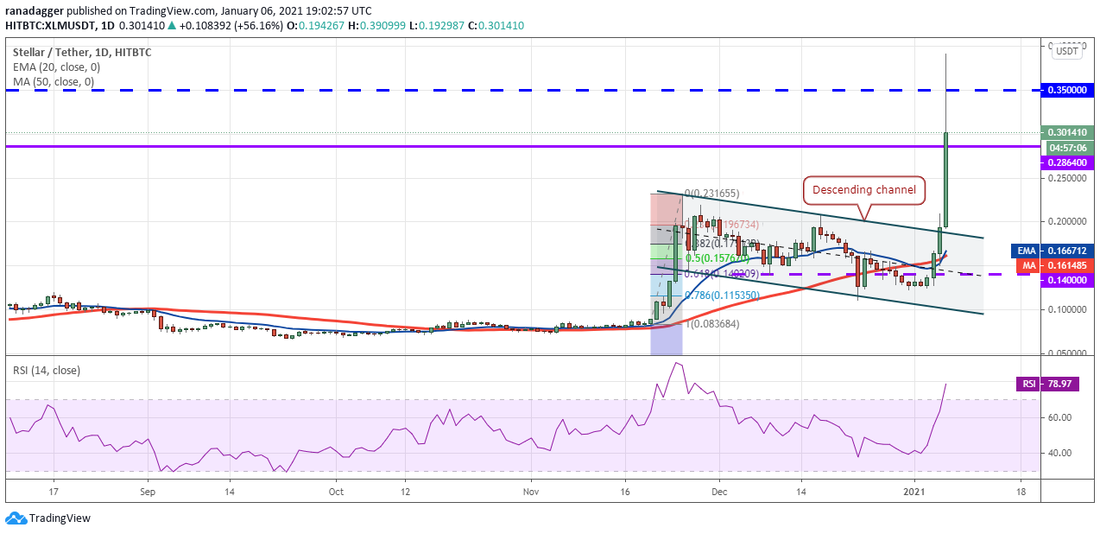 However, the long wick on the day’s candlestick suggests profit booking above $0.35. The bears will now try to pull the price back below $0.2864. If they succeed, the XLM/USD pair may enter a minor correction. Conversely, if the bulls flip $0.2864 to support, the pair may resume its uptrend. If the price breaks above $0.391, the rally could extend to $0.50. LINK/USD Chainlink (LINK) bounced off the 20-day EMA ($13) on Jan. 4 and the 50-day SMA ($13.07) on Jan. 5, which shows strong buying on dips. The moving averages are on the verge of a bullish crossover, suggesting buyers are in control. 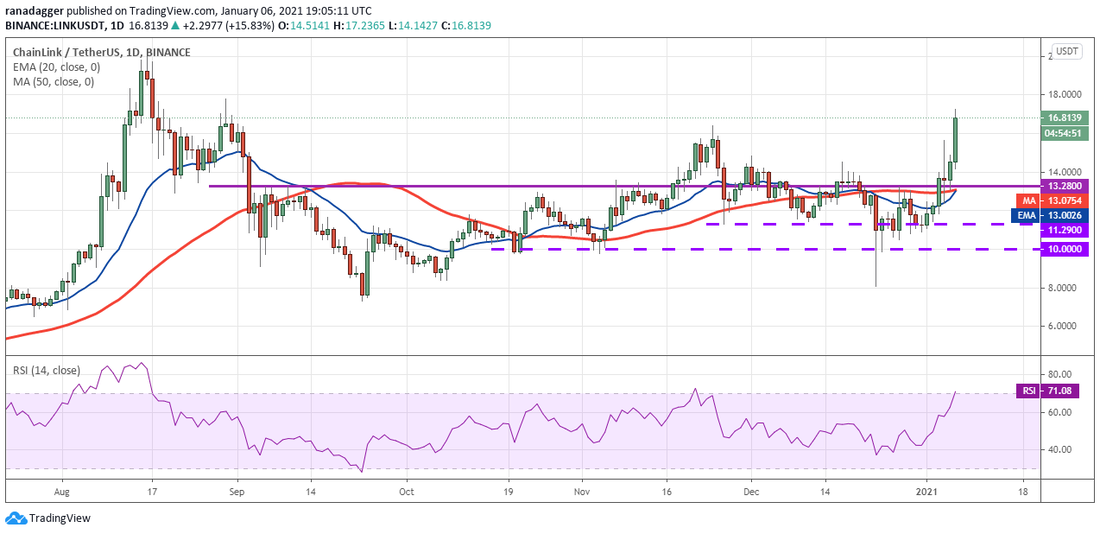 If the bulls can sustain the LINK/USD pair above $16.39, the rally could extend to $20.1111. The bears are likely to defend this resistance aggressively. However, if the bulls do not give up much ground, the possibility of a break above $20.1111 increases and the next target objective on the upside is $25. This bullish view will invalidate if the price turns down from the current levels or the overhead resistance and breaks below the $13.28 support. Such a move will suggest a lack of demand at higher levels. BNB/USD Binance Coin (BNB) made a long-legged Doji candlestick pattern on Jan. 4 and followed it up with an inside day candlestick pattern on Jan. 5 that had a long tail. This suggests that the bears tried to pull the price down but the bulls purchased at lower levels. 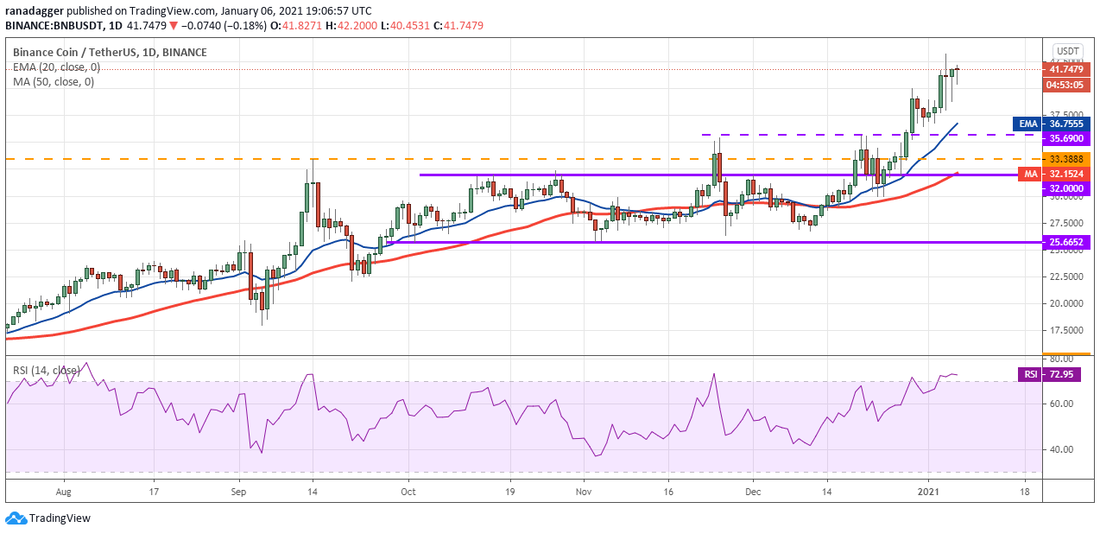 If buyers can drive the price above $43.2039, the BNB/USD pair may resume the uptrend and rally to $50. The upsloping moving averages and the RSI in the overbought territory suggest that the path of least resistance is to the upside.
On the other hand, if the pair again turns down from the overhead resistance level and breaks below $38, it will suggest that the bears have overpowered the bulls. That could result in a correction to $32. The views and opinions expressed here are solely those of the author and do not necessarily reflect the views of Cointelegraph. Every investment and trading move involves risk. You should conduct your own research when making a decision.
0 Comments
Leave a Reply. |
Authoranyone can contribute. Archives
May 2022
Categories |
 RSS Feed
