Bitcoin News

 Bitcoin pulled back to the ‘no-trade zone’ or ‘resistance zone’ as seemed to have pulled back from the break-away from the ascending triangle on 22nd April 2019 above $5600. While most traders believe with high probabilistic certainty that the ‘bottom is in’, the bears and bulls still seem to be in a tussle. The price of Bitcoin 12: 30 hours UTC on 25th April 2019 is $5494. It is trading 0.37% higher on a daily scale. The Bear Argument Tone Vays still suggests that the bullish move at the beginning of the month is a bull trap and the bear market isn’t over. On the weekly chart, he mentioned that “we were not able to hold the (200-Day) moving average. Hence, the consolidation continues between the 200-Day and 50-Day moving average.” 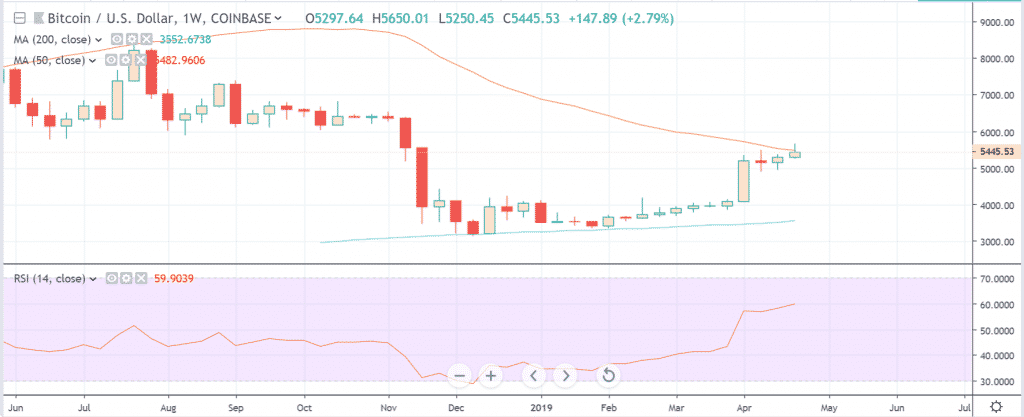 According to the 4-hour chart and 12-hour chart, Vays suggested that sequential candlestick principals pointed towards an obvious pullback. He expects “A short term correction most likely leading to a long term correction…” Bulls Maintain their Conviction As well While Tone Vays belonged to the class of bears, bulls like B.Biddles haven’t changed their perception either. According to a recent tweet by B.Biddles, “$BTC Okay, checking in on the ascending triangle… Looks like we closed above it, then retraced back into the resistance range. Not seeing anything to do here. Still holding my long w/ avg. entry $5212.” 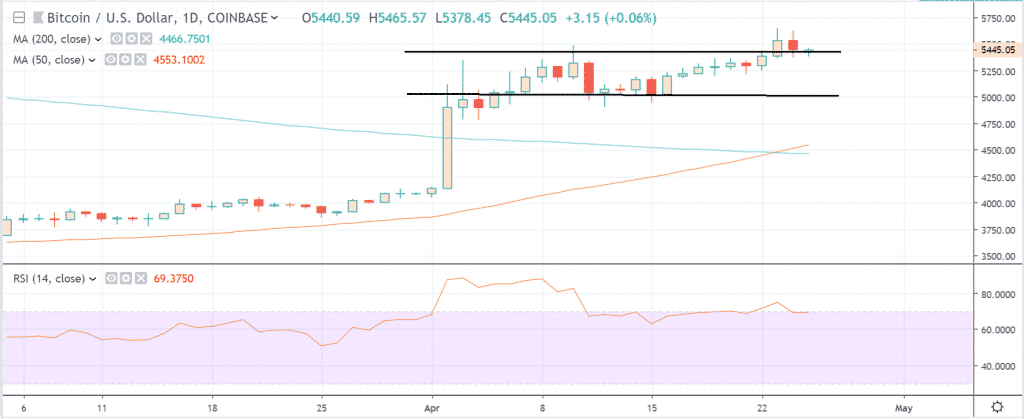 BTC/USD 1-Day Chart (Pull Back to the no-trade zone) Moreover, BTC seemed to pull back to the parallel channel above $5000 and $5450 leaving the traders uncertain. B.Biddles, however, stands with his earlier analysis of the BARR (Bump and Run Reversal) bottom pattern which suggests we have entered the Run side. Further, the principals of BARR align with the ‘back and fill trading‘ mentioned by Bitcoin [BTC] futures trader Jeff Kiburg. 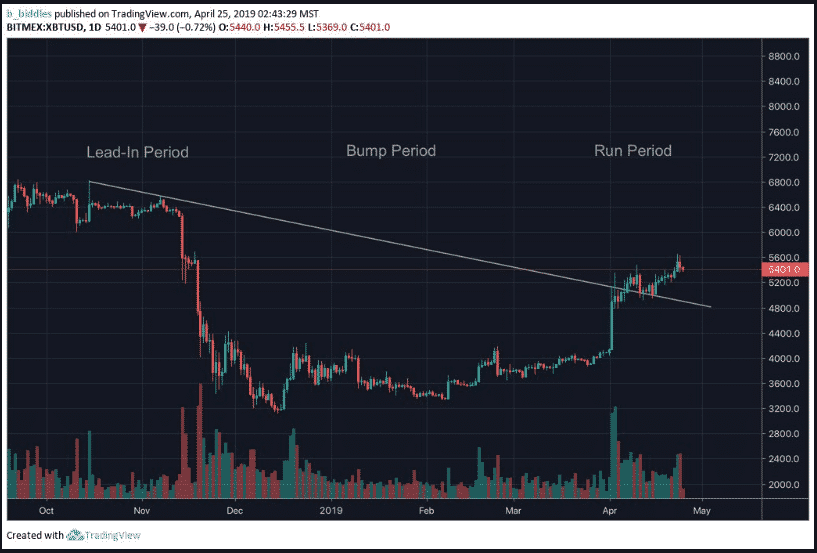 Therefore, the expectations of the market still seem to be split between the bull and the bear. Reportedly, the volume of Bitcoin Futures on CME is considerable which will expire for the month on Friday, 26th April 2019. Hence, it might have a huge effect on the price as the shorts will probably close to a net loss. Do you think the rally will continue or the bears are right? Please share your views with us.
0 Comments
 Bitcoin appears on track to end April on a positive note for the fourth consecutive year. The cryptocurrency is currently up 27 percent on a month-to-date basis. Increasing that monthly gain look unlikely, as the bulls will likely have a hard time forcing a convincing break above multiple resistance levels lined up in $5,200–$5,300 range. Prices may fall back below $5,100 in the next few hours, as the hourly chart relative strength index (RSI) has diverged in favor of the bears. Bitcoin (BTC) looks set to end April in the green for the fourth consecutive year, having confirmed a longer-term bull breakout earlier this month. The world’s largest cryptocurrency by market capitalization is currently trading at $5,200 on Bitstamp, representing a 27 percent gain on the month’s opening price of $4,092. BTC previously rallied 8, 26, and 33 percent in the fourth month of 2016, 2017 and 2018, respectively. The sharp rise seen this month seems to have put the bulls in a commanding position for a long haul. The cryptocurrency has violated the most basic of all bearish technical patterns – the lower highs, lower lows – with a convincing move above $4,236. Prices have also found acceptance above the 200-day moving average (MA), currently at $4,520, for the first time since March 2018, a sign of a bull market. These gains look sustainable, too, courtesy of a sharp rise in trading volumes. For instance, 24-hour trading volume across all exchanges jumped to a 15-month high of $22.89 billion on April 3 – the day BTC solidified the bull breakout with a move above $5,000. As a result, a drop all the way back to the monthly opening price of $4,092 on or before April 30 looks unlikely. 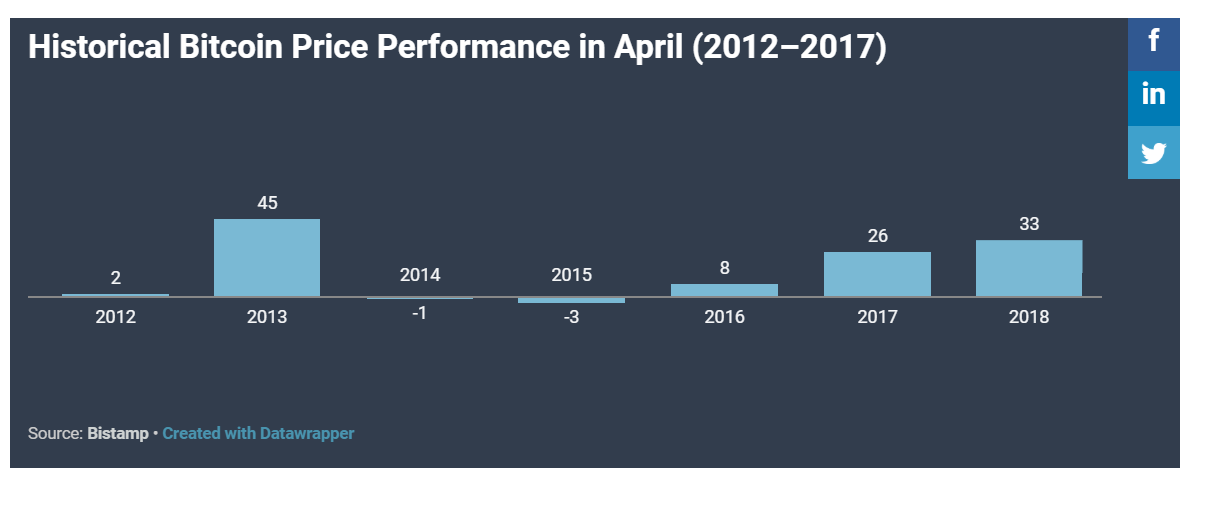 Bitcoin has posted April gains in five out of the last seven years. The cryptocurrency gained 45 percent in the fourth month of 2013, its biggest April gain on record. That record will likely stay intact, as BTC may have a tough time finding acceptance above multiple key resistance levels lined up above $5,200 in the short-run. Monthly and weekly charts 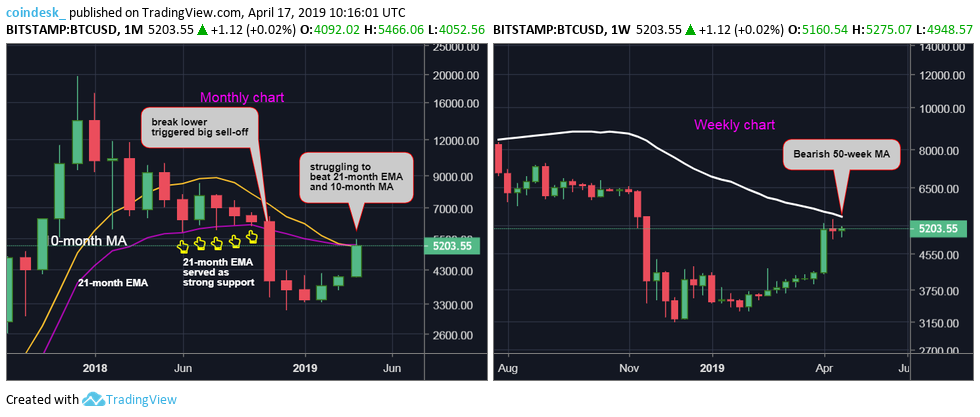 As seen above (left), the 21-month exponential moving average (EMA) served as strong support in five months to October 2018. Further, a downside break of the line in November was followed by a sell-off to lows near $3,100 by December. As a result, the 21-month EMA, currently at $5,237, is the level to beat for the bulls. Forcing a break higher, however, could be a tough task with short-term technical indicators reporting overbought conditions. Other bearish technical lines located near the 21-month EMA could also keep the gains under check. For instance, the descending (still bearish) 10-month and 50-week MAs are located at $5,180 and $5,546, respectively. While the three-day chart’s 100-candle MA, currently at $5,239, is also proving a tough nut to crack, as discussed yesterday. Usually, such a strong band of key resistance lines is breached after multiple attempts. So, the probability of BTC extending gains before the month end appears low. In fact, the cryptocurrency may end the current month with lesser gains if the price finds acceptance below the crucial support at $4,912. Weekly chart 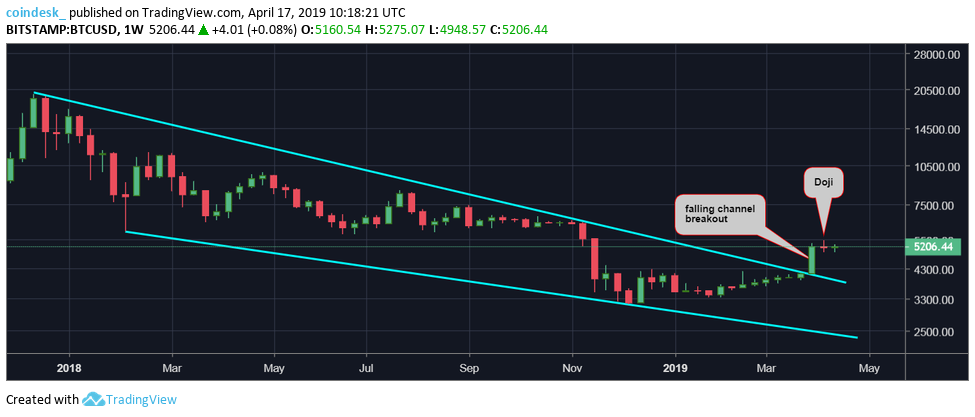 BTC closed at $5,190 on April 3, confirming a falling channel breakout on the weekly chart. A similar looking pattern in 2015 paved way for a three-year bull run. So far, however, the follow-through to that longer-term bullish breakout has been discouraging. Notably, the cryptocurrency witnessed two-way business last week before ending on a flat note. The resulting doji candle is indicative of indecision among the bulls. That buyer exhaustion would gain credence, inviting stronger selling pressure, if the cryptocurrency closes (UTC) below $4,912 (doji’s low) this Sunday. A bearish close, if confirmed, could yield a deeper pullback to levels below $4,600. As for today, BTC may fall back to levels below $5,100, according to shorter-duration technical charts. Hourly chart 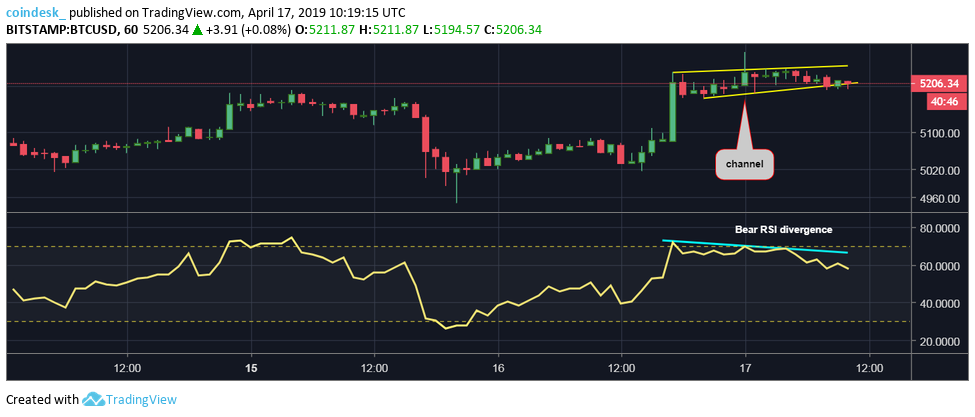 An hourly close below the channel support, currently at $5,200 would validate the bearish divergence of the relative strength index (RSI) and fuel a drop to $5,100 and below.
The bearish divergence of the RSI would be invalidated if the price finds acceptance above the upper edge of the channel, currently at $5,250.  I always write about this basic idea when it comes to any investing: which way is the market going, up or down? If you know, you are in great shape; if you don’t, you should not be playing at all. This is the question on bitcoin. All last year I was saying, “It’s going down, hopefully to about $2,500.” It hit the low $3,000s. Now bitcoin is going up and I will be saying “It’s going up.” I think it will hit $6,000 soon and go on to $10,000. At $10,000 I will look to recalibrate. For now the crypto winter is over. Here is the chart: 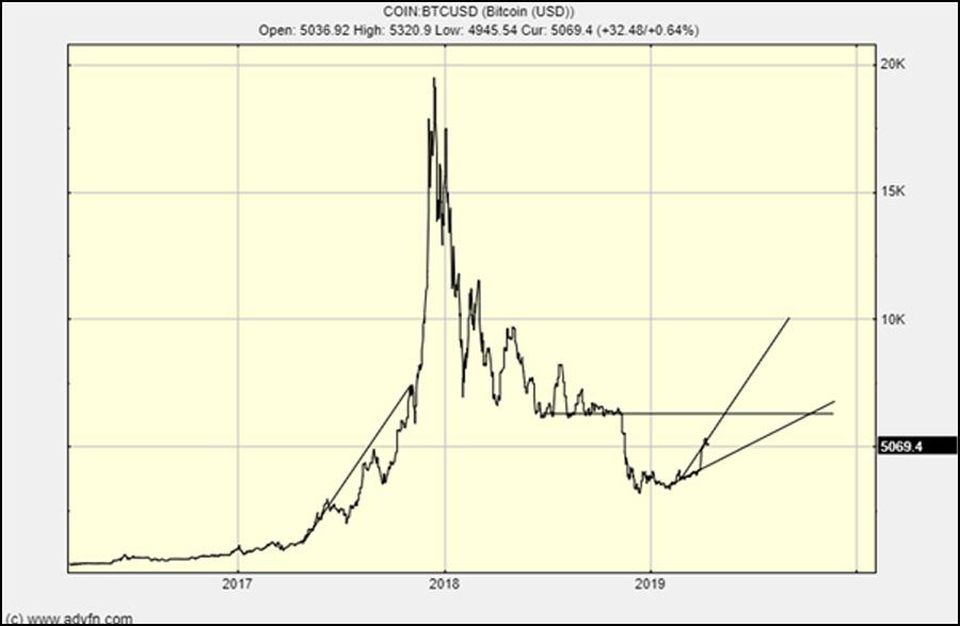 This is a simple chart with some guidelines and there is a clear pathway upwards. There is apparently a lot of China interest in crypto right now, with tether selling at a premium. This makes sense if the market considers a yuan dollar depreciation on the cards. Tether has been shown to be resilient, even if it is still a controversial coin. It remains a good place to stash capital from short-term moves, be that from bitcoin volatility or ‘fiat’ privations. Money flowing into stablecoins is going to lift bitcoin because fundamentally money flowing into crypto is what sustains and raises prices. Bitcoin and altcoins have to have positive money flow because they are "mined" and have their monetary bases expanded with every block. For bitcoin $9 million of new money must enter every day to match new supply. It's not that straight forward because if miners hodl on to some or all of their bitcoin, less money needs to enter on a daily basis to prop up the price. In the end, however, supply and demand creates the price and for new supply to be matched at current levels, more than $3.3 billion dollars has to flow into bitcoin to make it go up. That might seem a lot but it is not when you see the scale of modern markets. Gold production is $140 billion, so that’s the amount of fiat that most come into the system to keep its price around $1,300 an ounce. Both assets have about the same emission as a percentage; the difference being the market cap of gold is about $5 trillion and bitcoin is $0.09 trillion. Gold is the global asset to hedge against risk and investors are incredibly interested in it. It is a mainstream asset dwarfing equities and other assets in the mind of the man in the street as an "investment." 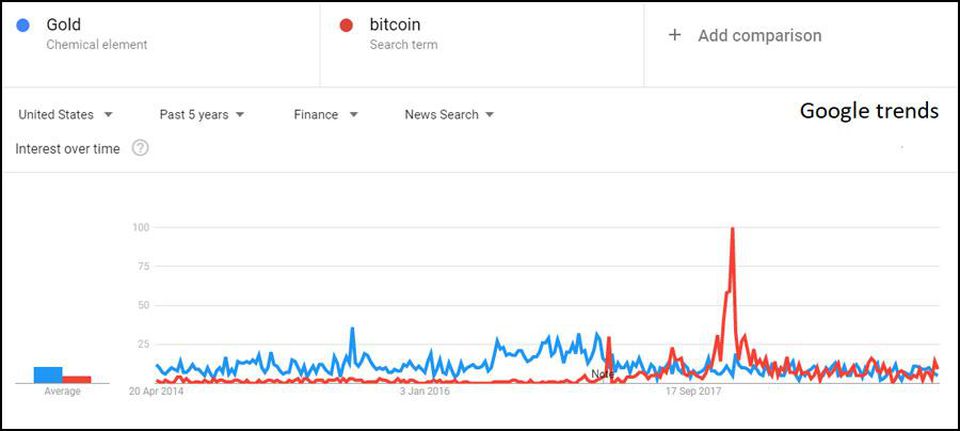 When you drill down into mindshare, when you look at interest in the financial news, you can see what looks like bitcoin eating into the interest in gold, at least in the U.S. If you look at the global picture this trend can’t be seen as clearly and when you appreciate global interest in gold is driven by countries with low tech penetration it suggests that as time passes, bitcoin and crypto will increasingly share the flight capital/risk asset crown with gold. 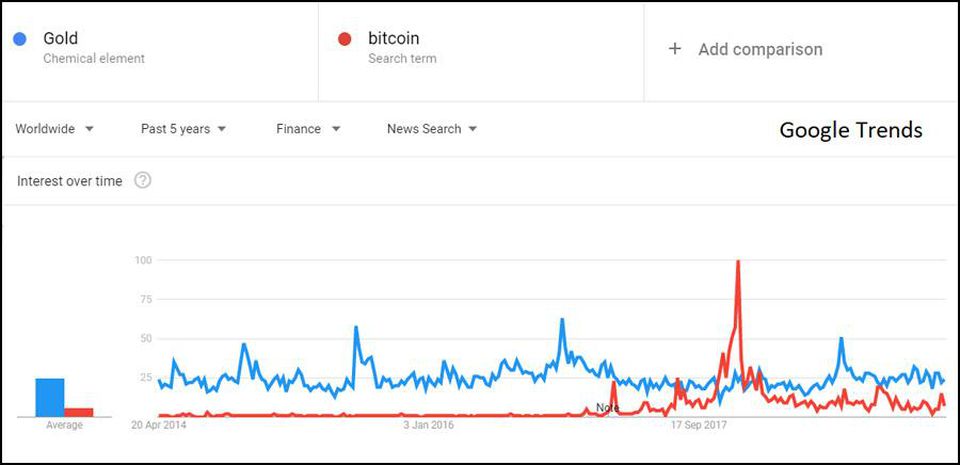 Even if bitcoin takes 20% of that market, bitcoin will be through its previous $20,000 high. That is without bitcoin continuing to be used for transactions or any other emergent use case or situation.
Bitcoin winter is over, the price is going up, the only question is how high. For now $6,000 is an easy target and $10,000 a coin this year is not such a hard target. I’m still accumulating. 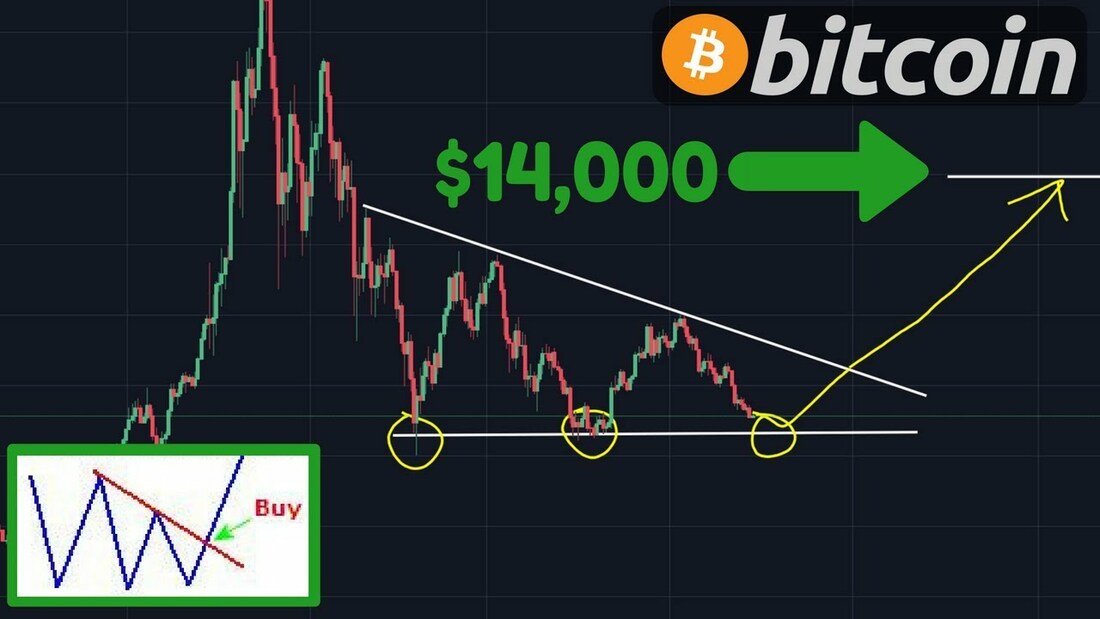
The Bottom Might Just Be In, Trader Suggests
As much as bears like to harangue that Bitcoin (BTC) has yet to bottom yet, more and more analysts are convinced that there is a high likelihood that the collapse to $3,100 might have been it for this cycle.
Jonny Moe, a well-followed trader and technical analyst in the crypto industry, recently touched on why this is the case, explaining this theory in a three-part Twitter thread that broke down this topic to the nitty-gritty. Jonny, who sports a following of over 15,000, explained that Bitcoin is about to see its first bullish 20-day and 200-day simple moving average (MA) cross since October 2015, which came as this budding market began its recovery to eventual new all-time highs.
While there isn’t an actual term for this crossover, Jonny, among other analysts, see this as a fact that Bitcoin has broken past resistance, and has a solid amount of potential to rally higher, rather than pullback drastically off highs. As the analyst explains: the 20-200 crossover is “a slightly faster version of the famous golden cross, typically 50-200.”
Interestingly, the bonafide golden cross, while not active yet, will come to fruition in the coming weeks, barring that Bitcoin and other cryptocurrencies keep up their current bullish momentum. And that, my friends, is why Jonny is coming increasing convinced that “it’s certainly shaping up [that the bottom being in] could be a real possibility.”
Jonny Moe isn’t the first to have popularized the theory that December’s collapse was the “worst comes to worst” moment of the current cycle, far from. More On Why Bitcoin Bottoming At $3,100 “Makes Sense” As reported by Ethereum World News previously, Josh Rager, a team member at crypto exchange startup Level, recently claimed that after some thinking about Bitcoin’s potential bottom, $3,100 might have been it “for two reasons.”
He looks to the fact that retail investors had many buy orders in the $1,800 to $3,000 range, especially due to analysts calling for further lows as an indicator that $3,100 may have been the bottom. This, of course, is in reference to the theory that going against the crowd in markets often proves better than going with it. (Arguably, the tables have turned though, as by and large, crypto’s biggest names are extremely, even overly bullish, meaning that this theory sets a precedent for an impending collapse.)
The second theory that Rager drew attention to is the fact that $3,100 is a very attractive investment point for institutional players and high net-worth individuals, making it less than likely that Bitcoin could fall under that region. This, of course, is postulation, but theory does make sense, especially considering that volumes on the CME’s Bitcoin futures contract have been breaching all-time highs, even in this bear market.  Investors, traders, and speculators are jumping into the Bitcoin and cryptocurrency markets again, sending prices soaring across the board. Over the last seven days, Bitcoin has gained 25.74%, Ethereum 18.76%, Ripple 16.12%, and Litecoin 53.20%--see table 1. The rally was extended across the cryptocurrency markets, with 94 out of the top 100 cryptocurrencies gaining in price-see table 2. Table 1 7d Price Change For Major Cryptocurrencies Cryptocurrency %7d Bitcoin 25.74 Ethereum 18.76 Ripple 16.12 Litecoin 53.20 Source: Coinmarketcap.com 4/7/19 at 11 a.m. YOU MAY ALSO LIKE Table 2 Number of Cryptocurrencies That Advanced/Declined In The Top 100 Ranks Cryptocurrencies Advance/Decline Number Advance 6 Decline 94 Source: Coinmarketcap.com 4/7/19 at 11 a.m The recent Bitcoin rally has left left stocks, bonds, and the yellow metal in the dust, so far, in 2019-see chart. 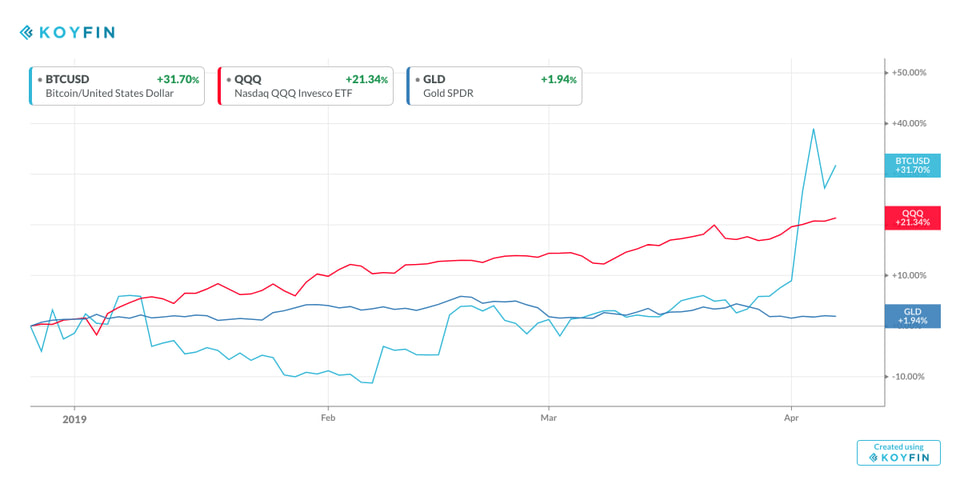 Bitcoin Beats Stocks, Bonds, and Gold YTD KOYFIN
What could explain the rally? Several factors. One of them is the renewed interest by big money. “The recent surge in Bitcoin has been sparked by a large buy order – rumored to be around $100 million – that sent BTC straight through technical resistance ($4,235) that had been in place since the start of December 2018,” says Nicholas Cawley from the DailyFX team.” “The lack of volatility in Bitcoin over the last few weeks has kept prices in-check, and low volume markets are always more susceptible to sharp moves than more liquid markets.” Kirill Bensonoff, a technology advisor, agrees. “The surge was obviously fueled by a very large order, in the tens of millions of dollars,” says Bensonoff. “This is another sign that institutional players are coming into the market.” Then there’s the prospect of lower interest rates, which turns risk on again for all sorts of speculative investments. And there are the “market technicals.” Market volumes are up 3 to 4 times normal turnover, exacerbating the sharp rally,” observes Cawley. “In addition to the clean break of resistance, the move also broke through the 200-day moving average around $4,650 with ease, enabling the rally to continue.” How far will the rally go? Will Bitcoin ever reach the $20,000 mark again? It all depends on whether regulators will approve financial instruments that allow for broad investor participation in the cryptocurrency markets, like Electronically Trading Funds (ETFs), according to Bensonoff. “For Bitcoin to hit $20,000 in 2019, we would need a major catalyst, and I believe the only one with this much force would be ETF approval,” says Bensonoff. “Without it, we are looking at a $10,000 best case scenario.” While it’s unclear whether which of the two scenarios will come true, one thing is clear: volatility will continue in the cryptocurrency markets, creating new winners and losers. [Ed. note: Investing in cryptocoins or tokens is highly speculative and the market is largely unregulated. Anyone considering it should be prepared to lose their entire investment. Disclosure: I don't own any Bitcoin.] |
 RSS Feed
